A range bar chart is a sort of graphical representation that graphically shows the extremes of a data set. Instead of focusing on a single data point like regular bar charts do, range bar charts show the entire range of values, from low to high. The vertical length of each bar in the graph shows the spread of values within a given data point or category. Range bar charts are useful for data visualization and decision-making in many fields, including finance, stock market analysis, project management, and statistical analysis, because they allow viewers to compare and analyze the distribution, trends, and fluctuations in data with ease.
Applying the range bar chart on TradingView to the nifty.
These steps can be used to add a range bar chart for the Nifty index on TradingView:
Search for the Nifty index symbol in TradingView. On TradingView, the Nifty index is commonly denoted by the symbols “NIFTY”.
Locate the chart type selection panel, which is often found at the top of the chart window, once the Nifty index chart has been displayed. The symbol for it is a candlestick.
When you click on the chart type selection panel, a drop-down menu containing different chart kinds will display. Select the “Range Bars” option if you can find it.
If you choose “Range Bars,” you can then be prompted to choose the desired range size for each bar. The price range that each bar represents is determined by the range size.
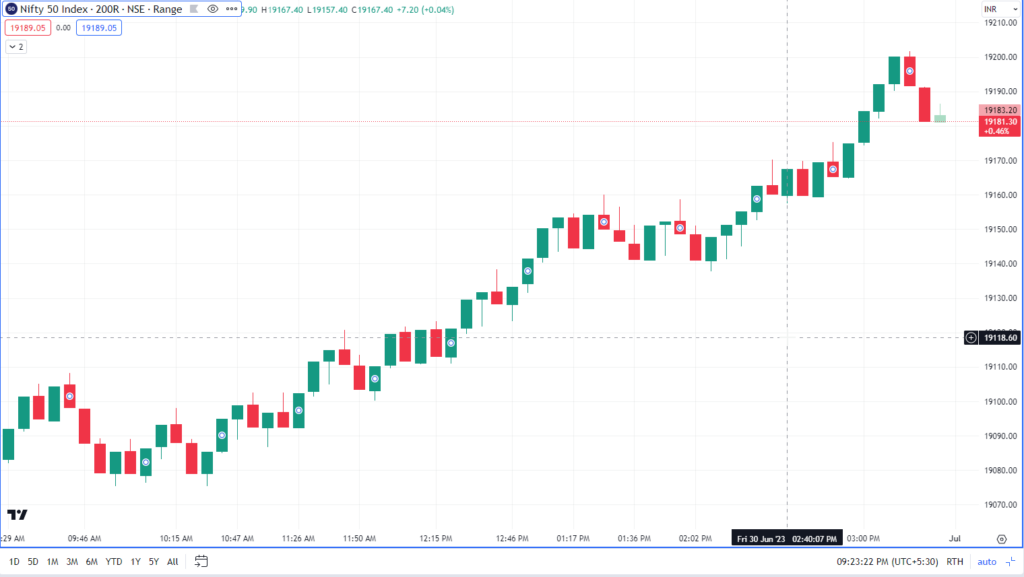
The Nifty chart will change to a range bar chart display after you’ve picked the range size, with each bar reflecting the chosen range.
By changing the time period, using indicators, drawing tools, and utilizing other chart analysis strategies offered by TradingView, you may further personalize the range bar chart.
You may use a range bar chart on TradingView to analyze price changes, trends, and other technical elements of the Nifty index by following these instructions.
Range Bars Chart Range settings for Nifty.
The range settings for plotting 1 point of change are 20 range. (For instance, 19000 to 19001 or 19000 to 18999)
The range parameters are 200 range for a plot of 10 points of change. (For instance, 19000 to 19010 or 19000 to 18990)
To achieve the required range settings, multiply the desired capture points by 20.