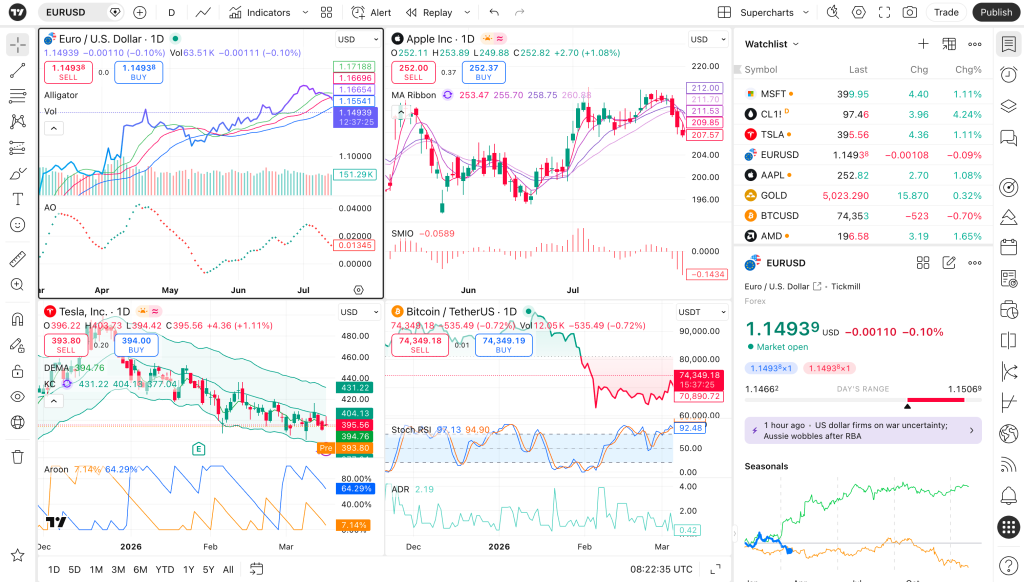


If you have ever tried to open more than one chart in a single TradingView tab and hit a wall, you already know this is not a browser setting or a preference you toggle on. It is tied directly to your subscription tier, and the jump between tiers changes what a “normal” trading screen looks like more than almost any other feature on the platform.
This guide breaks down exactly how many charts you get at each plan level, what a layout actually looks like in practice at each tier, and how to decide which one you need before you pay for more than you will use.
Why Multi-Chart Layouts Matter More Than They Seem To
A single chart tells you what a stock or symbol is doing right now, on one timeframe. Trading rarely works that way. You are usually checking a daily trend, a shorter intraday move, and maybe a related index or sector chart, all at the same time, to confirm what you are seeing before you act on it.
Multi-chart layouts let you do that inside a single tab instead of flipping between tabs or windows. Combined with Tab Linking and Crosshair Sync across multiple monitors, this is one of the two features that most changes how a TradingView workspace actually functions for active trading, rather than just casual chart-checking.
Chart Capacity by Plan
Here is what each tier actually gives you inside a single tab:
- Basic (Free): 1 chart per tab
- Essential: 2 charts per tab
- Plus: 4 charts per tab
- Premium: 8 charts per tab
- Ultimate: 16 charts per tab
This scaling is not arbitrary. Each step roughly doubles your capacity, and the jump from Essential to Plus, or Plus to Premium, is usually the point where traders notice their workflow actually opening up rather than feeling cramped.
Indicator limits, alert counts, and historical data depth increase alongside chart capacity on each tier. As of this writing, Essential gives you 5 indicators per chart and 20 price alerts, Plus gives 10 indicators and 100 alerts, Premium gives 25 indicators and 400 alerts, and Ultimate gives 50 indicators and 1,000 alerts. Alerts on Essential and Plus also expire after two months and need to be reset, while Premium and Ultimate alerts don’t expire at all.
Every paid tier comes with a free trial: 30 days on Essential, Plus, and Premium, and 14 days on Ultimate. These figures and limits do get revised from time to time, so the TradingView pricing page is the best place to confirm current numbers before you commit to a tier.
What Each Layout Actually Looks Like
1 chart (Free): You are locked into tracking one symbol, one timeframe, at a time. Fine for learning or for someone who checks in on a single position occasionally. Not workable for anyone comparing timeframes or symbols side by side.
2 charts (Essential): A natural way to use two charts is the same symbol across two timeframes, for example a daily chart next to an hourly chart. For many traders moving off the free plan, this is the first tier where the platform stops feeling limited for actual technical analysis rather than casual browsing.
4 charts (Plus): Four charts opens up real multi-timeframe analysis, for example one symbol across four timeframes, daily, four-hour, one-hour, and fifteen-minute, all visible at once. It also works well for tracking four different symbols in the same sector simultaneously.
8 charts (Premium): At this level you can run a broader view, either deep multi-timeframe analysis on one symbol combined with a couple of correlated instruments, or a wider watch of several symbols you are actively trading in a single session. Premium is also the tier where technical alerts stop expiring and alert capacity jumps to 400, which matters as much as the chart count for anyone running multiple active setups.
16 charts (Ultimate): Built for scanning across a large number of symbols or running multiple independent strategies at once. This tier is aimed at professional or prop-style trading; for most retail traders the jump from Premium is more often about the higher alert, data, and connection limits than needing double the charts.
Choosing the Right Tier for Your Layout
If you are unsure which tier fits, the honest way to figure it out is to first build out the layout you actually want on paper. Count how many charts you genuinely check simultaneously during a normal session, not how many you could theoretically imagine using. It is easy to convince yourself an 8-chart Premium layout is necessary and then realize in practice you consistently look at the same 3 charts.
A reasonable approach:
- If you track one symbol across two timeframes: Essential covers it
- If you do real multi-timeframe analysis or watch a small sector: Plus is usually the sweet spot
- If you actively trade multiple positions across the day and need correlated charts open at once: Premium is where the workflow stops feeling constrained
- If you are running systematic scans across dozens of symbols or managing multiple strategies professionally: Ultimate is worth the jump
All paid tiers come with a free trial period, so the lowest-risk way to answer this for yourself is to start the trial on the tier you think you need and actually build your real layout before committing annually.
Multi-Chart Layouts vs Multi-Monitor Setups
It is worth being clear that multi-chart layouts and multi-monitor setups are two different things that stack on top of each other rather than compete.
A multi-chart layout is multiple charts inside a single tab, governed by your plan tier as described above. A multi-monitor setup uses TradingView’s desktop app to spread separate windows and tabs across physical screens, which is a workflow feature available regardless of plan tier, though obviously your plan still governs how many charts live inside any one of those windows.
Traders getting the most out of TradingView often combine both: an 8-chart Premium layout running on one monitor for multi-timeframe analysis of a core symbol, with a second monitor running a linked watchlist or a screener via Tab Linking. If you have not set up the multi-monitor side of this yet, the full setup walkthrough covers windows, Tab Linking, and Crosshair Sync step by step.
Bottom Line
Chart capacity is one of the clearest, most concrete differences between TradingView’s plans, and it is usually the first limit active traders actually run into. If you are still on Free or Essential and finding yourself constantly switching tabs to compare timeframes or symbols, that friction is usually the sign you have outgrown your current tier, not a sign you are using the platform wrong.
Start with the TradingView desktop app if you have not already, trial the tier that matches the layout you actually need (30 days on Essential, Plus, and Premium, 14 days on Ultimate), and build it out before deciding whether to commit annually.
Disclosure: Links to TradingView on this page are affiliate links. If you sign up for a paid TradingView plan through these links, this site may earn a commission at no extra cost to you.