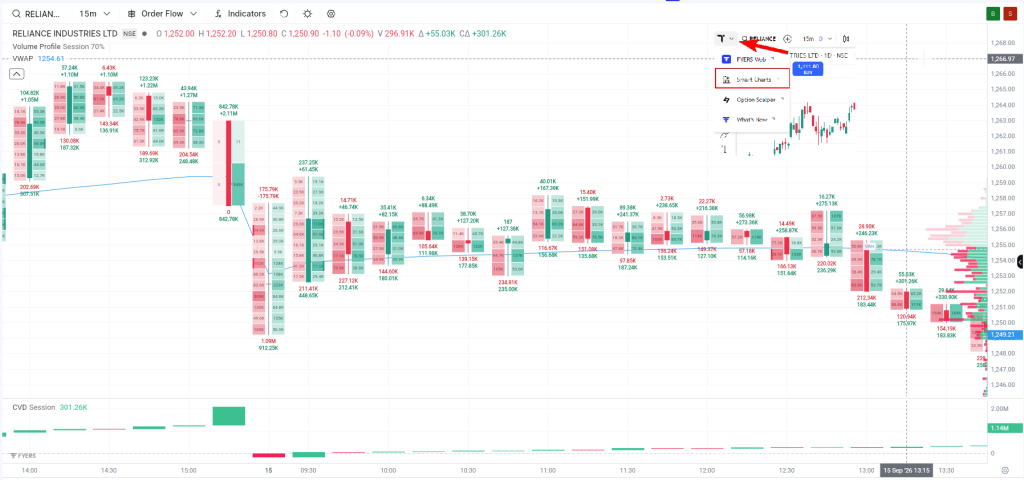


Fyers has added order flow charts to Smart Charts, its in-house charting platform on Fyers Web and the Fyers app. The feature went live on August 28, 2026, and lets you look inside a candle at the buy and sell volume traded at each price level, instead of just the open, high, low and close.
This is a Fyers-built feature, not a TradingView one. Fyers is also a TradingView broker partner and lists TradingView charts elsewhere on its platform, but Order Flow is specific to Smart Charts, the separate charting stack Fyers built internally.
What order flow actually shows
A regular candle tells you where price opened and closed. It doesn’t tell you what happened in between, how many individual trades pushed price there, or who was more aggressive along the way. Order flow breaks that candle apart into clusters, showing traded volume at each price level, split by buy and sell side.
Fyers’ own explanation frames it simply: the market doesn’t move candle by candle, it moves trade by trade. Order flow is meant to show that underlying activity.
The core metrics:
- Delta. Buy volume minus sell volume within a single candle. Positive means buyers were more active, negative means sellers were.
- Cumulative Delta. A running total of Delta across multiple candles, useful for spotting whether participation is tracking price or starting to diverge from it.
- Imbalances. A diagonal comparison between buy and sell volume at adjacent price levels. When one side clears a set ratio (300% is the example Fyers uses), that level gets flagged.
- Volume Profile. Shows where volume concentrated across a price range, with Point of Control (highest-volume price), Value Area High, and Value Area Low marked.
- VWAP and CVD Session, for tracking the session average price and cumulative buy/sell delta across the full trading day.
Fyers is also explicit that positive Delta shouldn’t be read as automatically bullish. If a candle shows strong buying but price barely moves, that’s a sign the buying isn’t translating into progress, not necessarily a bullish signal on its own. The support documentation frames the same idea around absorption (aggressive orders being met by enough resting liquidity to stall price) and exhaustion (Delta and imbalances weakening as a move continues, suggesting participation is fading even without a reversal).
Where it sits in the platform
Order flow is one of three views you can switch between inside the charting panel on Fyers Web, alongside standard Charts and Options Scalper. Watchlist, Option Chain, Option Analytics, Market Depth, F&O analytics, and news sit on the other side of the same screen, so the idea is to read order flow next to whatever else you’re already tracking, say, a support level flagged by Volume Profile, then watching Delta as price tests it, rather than as a standalone signal.
What’s still rough about it
The feature is new, and the community response on Fyers’ own forum makes the gaps fairly clear. A recurring request is more customization, particularly around Delta color shading and settings depth, since one user noted it’s currently difficult to eyeball delta at each price level without more visual control. Others have asked for drawing tools directly on the order flow view, a fixed range volume profile you can drag over a selection of candles, and sortable columns in the per-candle detail popup.
There’s also an open question, raised repeatedly in the comments, about methodology: whether Fyers receives an explicit buy/sell aggressor flag from the exchange for each trade, or infers it internally by comparing execution price to the best bid and ask. Fyers hasn’t published a public answer to that as of this writing, so treat the buy/sell split as Fyers’ own classification rather than a confirmed exchange-provided flag, until they clarify it.
Order flow data isn’t currently available through the Fyers API either. A user asked about pulling it into their own algo setup, and Fyers’ response was that it’s not part of the API yet, tick-by-tick socket data is the closest alternative for now.
Trying it
Order flow is live now on Smart Charts across Fyers Web and the Fyers app. If you already use Fyers, you can open it directly at fyers.in/web/charts/orderflow, or find it under the chart view switcher next to standard Charts and Options Scalper. Fyers’ support portal has a full breakdown of how to read clusters, Delta, and Volume Profile if you’re getting started with it.