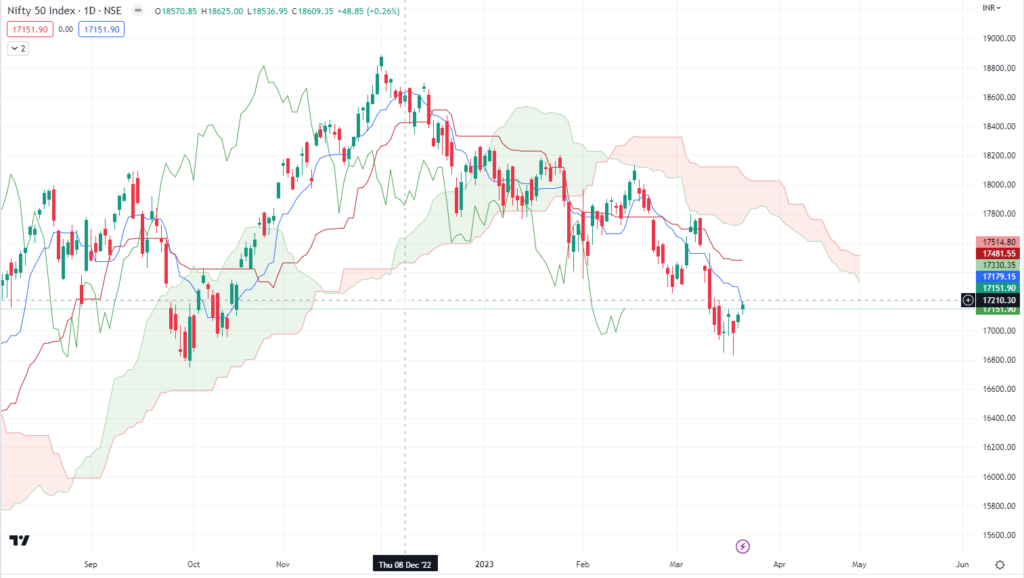
Ichimoku is a technical analysis trading strategy that uses multiple indicators to analyze financial markets. It was developed in Japan by a journalist named Goichi Hosoda in the late 1930s and has since become popular around the world.
The name “Ichimoku” means “one look” in Japanese, which refers to the idea that traders can get a comprehensive view of the market with just one glance at the chart.
The Ichimoku system consists of several components, including:
- Tenkan-sen: This is the conversion line, which is a moving average of the highest high and lowest low over the past nine periods.
- Kijun-sen: This is the base line, which is a moving average of the highest high and lowest low over the past 26 periods.
- Senkou Span A: This is the leading span A, which is the average of the tenkan-sen and kijun-sen, plotted 26 periods ahead.
- Senkou Span B: This is the leading span B, which is the average of the highest high and lowest low over the past 52 periods, plotted 26 periods ahead.
- Chikou Span: This is the lagging span, which is the closing price plotted 26 periods behind.
Traders who use the Ichimoku strategy look for specific signals from these indicators, such as when the Tenkan-sen crosses above the Kijun-sen, or when the price crosses above or below the Senkou Span lines. These signals can indicate potential buy or sell opportunities.
The Ichimoku strategy is popular among traders because it provides a more complete picture of the market than many other technical analysis tools.