A technical indicator divergence is a difference in the movement or direction of a security’s price and an indicator derived from that security’s price or volume, such as moving averages, momentum indicators (RSI, MACD) and oscillators, which are used to analyze the market trend and make predictions about future price movements. The divergence is typically identified by comparing the slope, direction, or position of the indicator and the security’s price. There are two types of divergence, Bullish Divergence and Bearish Divergence.
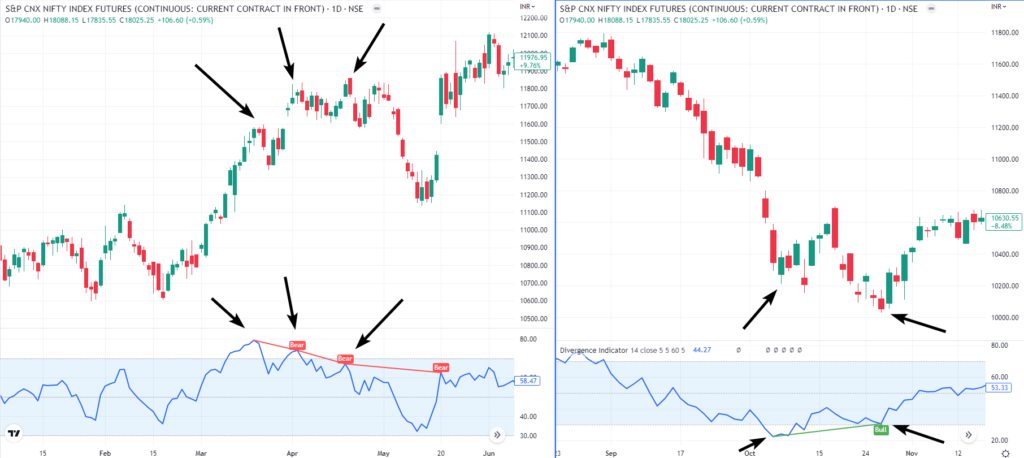
Bearish Divergence: This happens when the security’s price is making higher highs, but the indicator is making lower highs, this shows a bearish trend is starting to develop, and it could be a signal to sell the underlying asset.
Bullish Divergence: This occurs when the security’s price is making lower lows, but the indicator is making higher lows, this shows a bullish trend is starting to develop, and it could be a signal to buy the underlying asset.
While the divergence pattern is a useful tool for intraday traders, it’s important to note that it’s not a surefire signal to enter a trade. It should be used in conjunction with other indicators, chart patterns and market conditions, as well as considering any news events that may influence the market. Additionally, it’s always crucial to manage risk and use appropriate stop loss in any trading strategy