The majority of individuals searching for oil prices online aren’t futures traders with a Bloomberg terminal. They’re market participants examining energy markets, individuals curious about why fuel costs more this week, business owners tracking operational costs, or readers who just saw a headline about crude reaching a new high. The search is straightforward: what is oil trading at right now, and where can I see it?
TradingView is one of the top free tools available for this, and it functions whether you have a trading account or not.
Oil Price Has More Than One Number
“The price of oil” actually refers to a few different things depending on where you look. The two numbers you’ll see most often are WTI Crude Oil and Brent Crude Oil.
WTI (West Texas Intermediate) is the American benchmark, most relevant to U.S. markets and typically what American financial media quotes. Brent Crude is the global benchmark, used to price around 80% of the world’s internationally traded oil — so if you’re outside the U.S., Brent is usually the more relevant figure.
The two prices are usually within a few dollars of each other, but they don’t always move in lockstep. Political events, regional supply changes, and storage conditions can cause the gap between them to widen or narrow. Neither number is wrong — they’re just measuring slightly different things.
Checking Oil Prices on TradingView
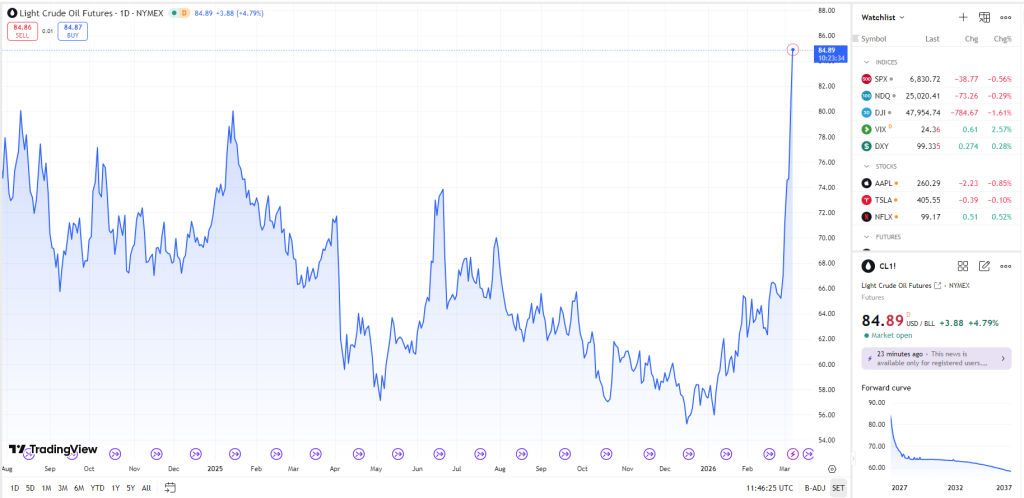
View live Crude Oil Price chart on Tradingview
TradingView lets you pull up a live oil price chart without signing up or paying for anything. Search for CL1! to get WTI Crude Oil futures, or BZ1! for Brent Crude. These are continuous futures contracts, meaning the chart automatically rolls to the next active contract so you’re always looking at a current price rather than an expired one.
The default view is a candlestick chart, where each candle shows the open, high, low, and close for a selected time period — from one minute to one month. The current price sits at the top of the chart. To see how today’s price compares to last week or last year, you zoom out.
You can also add basic indicators like moving averages, which show the general direction oil has been trending over time. No financial background needed to read these at a surface level — a rising line means oil has been getting more expensive, a falling line means the opposite.
Why the Oil Price Moves So Much
Oil is one of the most volatile commodity markets in the world. Several factors drive price changes on a regular basis.
Supply decisions carry significant weight. OPEC+, the bloc of major oil-producing countries including Saudi Arabia and Russia, periodically decides how much oil member nations will pump. Production cuts push prices up. Output increases push prices down.
U.S. inventory data moves markets every week. The Energy Information Administration publishes a weekly report on how much crude is sitting in American storage. Higher-than-expected stockpiles usually signal weak demand and pull prices lower. Lower stockpiles point to tight supply or strong demand, which lifts prices.
Geopolitical events create recurring disruptions. Conflict or instability in major producing regions — particularly the Middle East — can spike prices quickly. Markets often react to the risk of supply disruption before anything has actually changed on the ground.
The U.S. dollar moves inversely to oil in most conditions. Oil is priced in dollars globally, so when the dollar strengthens, it effectively makes oil more expensive for buyers in other currencies, softening demand. A weaker dollar works the other way.
Economic conditions shape demand expectations over the longer term. Strong global growth drives higher oil consumption. Slowdowns and recessions reduce it, and prices typically reflect that shift.
A Single Price Number Tells You Very Little
View live Crude Oil Brent Chart on TradingView
This is where checking oil on TradingView has a real advantage over a quick Google search. A raw price figure with no context is hard to interpret. Is it near a historical high? Coming off a sharp sell-off? Stuck in a range it’s been trading in for months? The chart answers all of that immediately.
Crude oil has a long history of extreme price swings — driven by wars, recessions, supply shocks, and demand collapses. Where the current price sits within that longer history matters. TradingView lets you scroll back years on the same chart, which gives you a frame of reference that a single number never can.