Market bottoms and tops develop over time. They are shaped by broad participation, shifting sentiment, and gradual exhaustion of buying or selling pressure. Observing how prices behave across a wide set of stocks often provides clearer signals than watching index levels alone. The Reversal – Intraday Screening feature, available under Column AC in the Intraday Scan tab on Fatafat, is designed to capture these early shifts.
This feature identifies stocks where the current market price is reversing after three consecutive days of upward or downward movement. While many traders use it for short-term stock selection, its real value emerges when the data is read at a market-wide level.
Understanding the Reversal Signals in a Market Context
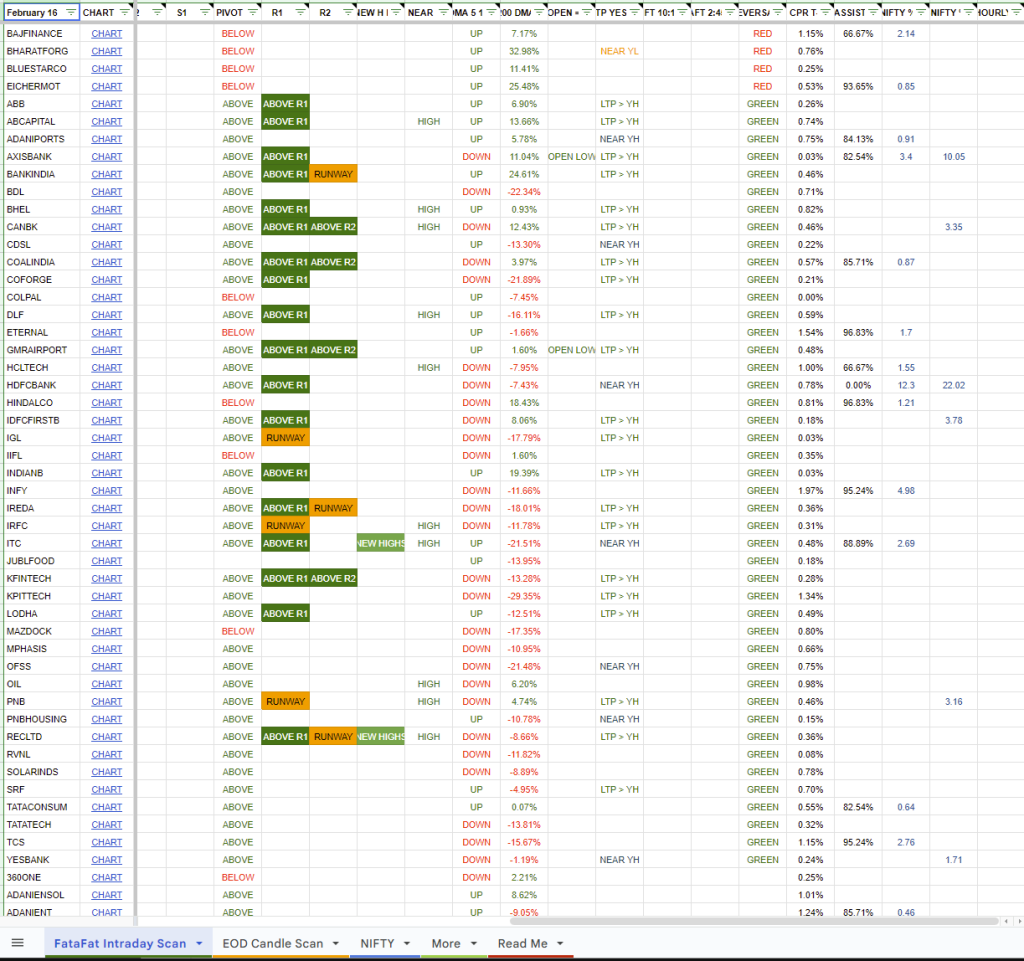
The screener marks reversals using simple color coding:
- GREEN: Price is reversing higher after a decline or consolidation
- RED: Price is reversing lower after an advance or consolidation
Individually, these signals can be noisy. Markets are full of false starts. However, when a large number of stocks begin flashing the same color within a short time window, it often reflects a broader shift in market sentiment.
Market bottoms and tops are defined by participation. They form when selling or buying pressure becomes exhausted across sectors, not just in a few names.
Identifying Market Bottoms Using GREEN Clusters
A potential market bottom starts forming when selling pressure fades. This usually happens after several days or weeks of decline, accompanied by pessimistic sentiment and weak breadth.
When the Fatafat screener begins showing a surge in GREEN reversal signals across multiple sectors, it suggests that:
- Downward momentum is losing strength
- Buyers are stepping in after sustained declines
- Short-term selling cycles are ending simultaneously
This clustering effect matters more than the signal itself. A handful of GREEN reversals is normal in any market. A sharp expansion in GREEN signals, especially after an index-level decline, often aligns with early stages of a market bottom.
Historically, market recoveries tend to start quietly. Breadth improves before headlines turn positive. Reversal-based screeners help surface this improvement earlier than index charts alone.
Identifying Market Tops Using RED Clusters
Market tops are formed through distribution rather than panic. Prices move higher, optimism increases, and reversals begin appearing as buyers become selective.
When RED reversal signals start dominating the screener after an extended rally, it can indicate:
- Profit booking after consecutive up days
- Diminishing follow-through on breakouts
- Early signs of exhaustion across the market
A rising index with increasing RED reversals underneath often points to weakening breadth. This divergence is a common feature near intermediate or short-term market tops.
Instead of waiting for sharp declines, tracking RED signal expansion helps identify when upside momentum is slowing across the broader market.
Why This Works Better Than Watching Indices Alone
Indices are weighted and can be distorted by a few large stocks. Reversal screening works on participation, not weight. When hundreds of stocks simultaneously show reversal behavior after similar price cycles, it reflects real changes in demand and supply.
Professional market analysis often relies on advance-decline data, new highs versus new lows, and sector rotation. The Fatafat Reversal screener provides a simplified, visual way to observe similar dynamics without complex indicators.
Practical Application
To use this feature for market timing, track the daily count of GREEN versus RED signals. Create a simple ratio or chart that shows the balance between bullish and bearish reversals. Sharp spikes in GREEN signals during market weakness often coincide with short-term bottoms, while surges in RED signals during rallies can mark exhaustion points.
The three-day requirement built into the Fatafat screener provides an ideal balance—long enough to filter out daily noise but short enough to catch reversals before they’re obvious to everyone. This timeframe captures genuine momentum shifts without the lag that longer-period indicators introduce.
Consider context when evaluating these signals. A cluster of reversals carries more weight when combined with extreme market conditions. GREEN reversals during oversold market conditions (after sharp declines) or RED reversals during overbought conditions (after strong rallies) have higher predictive value than those occurring in neutral markets.
Limitations and Confirmations
No single indicator predicts market turns with perfect accuracy, and reversal screeners are no exception. False signals occur, particularly during choppy, range-bound markets where stocks reverse frequently without establishing clear trends. The three-day window helps but doesn’t eliminate this issue.
Use the reversal count data alongside other market breadth indicators. Compare your GREEN/RED signal counts with advance-decline lines, new highs versus new lows, and general market sentiment. When multiple breadth measures align with reversal patterns, confidence in potential market turning points increases substantially.
The beauty of repurposing a stock screener for market timing lies in its simplicity. Instead of complicated calculations or proprietary indicators, you’re simply counting how many stocks are attempting to change direction at the same time. This collective behavior—when hundreds of individual stocks make similar decisions about trend changes—often precedes the turning points that move entire markets.