Trendline breakouts are among the most reliable price action signals available to intraday traders — but spotting them manually, across hundreds of stocks, during live market hours is simply not practical. That’s where the FataFat Intraday Stock Screener fills a genuine gap. Its dedicated trendline breakout scanning feature automates the identification process, surfacing actionable setups the moment they develop.
What the Trendline Screener Actually Does
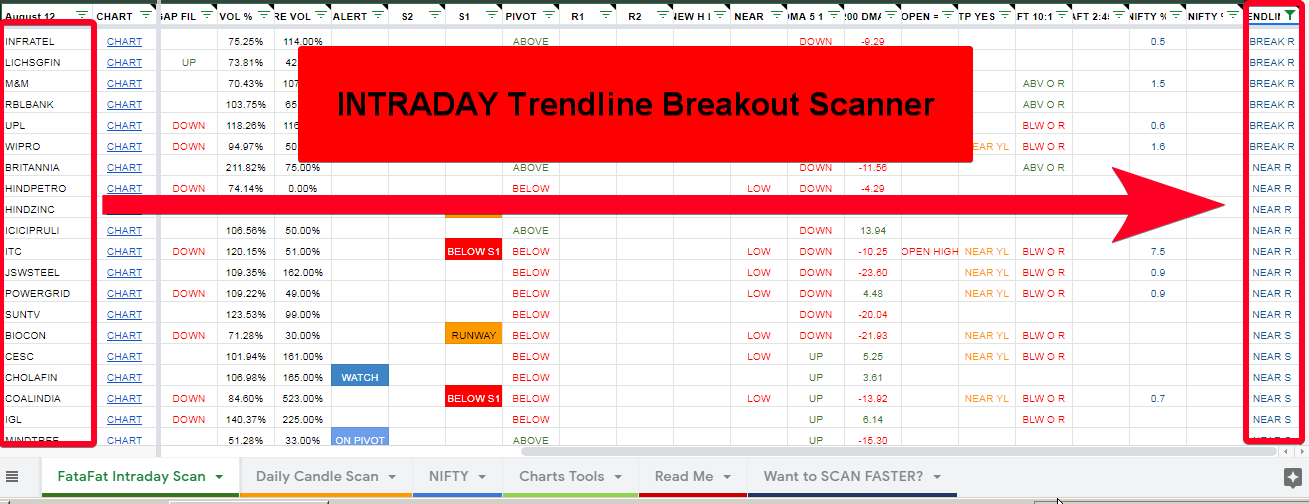
FataFat’s trendline scanning engine monitors the market during intraday and flags stocks across four specific conditions:
- Breaking Intraday Trendline Resistance — price pushing above a trendline, signaling a potential bullish reversal or upside continuation
- Breaking Intraday Trendline Support — price slipping below an trendline, signaling potential bearish momentum.
- Near Intraday Trendline Resistance — Highlights stocks nearing a breakout point, allowing you to prepare your order entry.
- Near Intraday Trendline Support — Highlights stocks nearing a bounce zone or a final breakdown level.
This four-way classification gives you both confirmed breakouts and early-warning proximity alerts — two distinct stages of the same trade opportunity.
Why Trendline Breakouts Matter Intraday
A trendline that has been tested across multiple swing points carries genuine market memory. When price finally breaks through that level with conviction, it often reflects a meaningful shift in supply-demand dynamics — not just noise. The challenge is that these moments are brief. By the time most traders notice a breakout manually, the move is often already underway.
A valid intraday trendline is typically drawn connecting at least two to three swing highs (for a descending resistance line) or swing lows (for an ascending support line). The more times price has respected that line, the more significant the eventual break tends to be. Volume confirmation is equally important — a breakout accompanied by a surge in participation is far more trustworthy than one occurring on thin activity.
Strategy Integration: The 15-Minute Rule
Price action requires context to be actionable. For trendline strategies, the 15-minute timeframe is the “sweet spot” for intraday trading. It is granular enough to capture momentum early, yet stable enough to filter out the noise and false breakouts often seen on 1-minute or 5-minute charts.
When the screener alerts to a trendline break, verification of the structure on a 15-minute candle chart is essential. A definitive close beyond the trendline combined with a surge in relative volume creates confluence—the automated screening paired with visual confirmation significantly increases the probability of a successful trade.
This approach balances sensitivity with stability. Five-minute charts amplify false signals; hourly charts miss intraday reversals entirely. The 15-minute interval captures the necessary granularity while reducing the whipsaws that plague faster timeframes.
Where This Feature Lives
The trendline breakout scanning feature runs during live trading hours and is available on the Premium version of the FataFat Stock Screener. Given that the screener is otherwise free to use, the Premium upgrade represents a focused investment in tools that directly support more structured, signal-driven intraday decision-making.
For traders who already incorporate trendline analysis into their approach, having a scanner that automates the identification step — and surfaces it across the full market universe — removes the single biggest friction point in executing this strategy at scale.