Most pivot point calculators hand you seven price levels and call it a day. Fata Fat Nifty Levels’ Automatic Pivot Point Calculator tool gives you nine levels—and that extra range might be exactly what you need when the market decides to go wild.
What You’re Actually Looking At
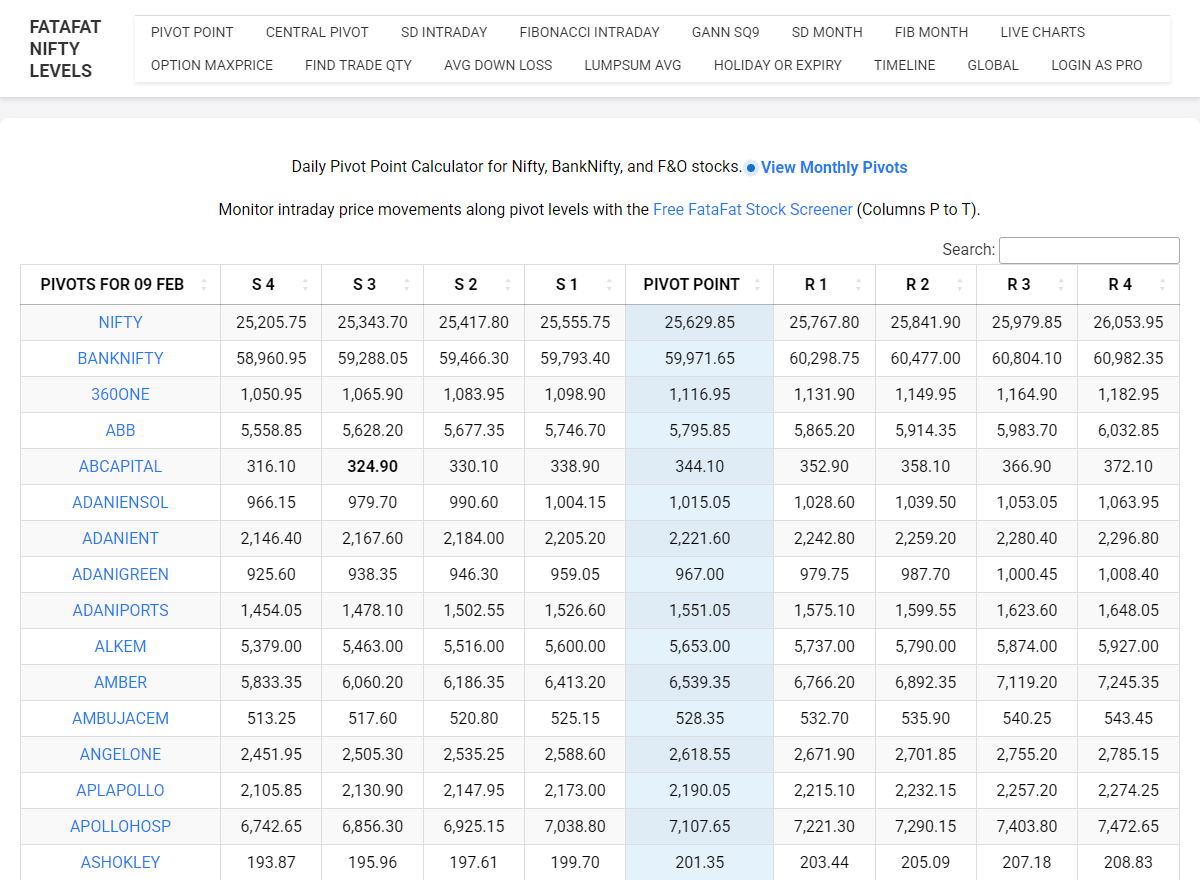
https://fatafatniftylevels.in/pivotpoint.php
Pull up the calculator, and you’ll see a clean table layout that gets straight to business. The date sits at the top—so you always know which trading session these numbers are for. No confusion about whether you’re looking at yesterday’s levels or today’s.
Then comes the meat: a grid showing S4, S3, S2, S1, Pivot Point, R1, R2, R3, and R4 for each instrument. That’s four support levels below the pivot and four resistance levels above it.
Beyond Just Nifty
Here’s where this tool separates itself from the basic calculators: it doesn’t limit you to Nifty alone.
Nifty gets top billing, obviously. The pivot sits in the middle, with support levels cascading down to S4 and resistance stretching up to R4. You get complete visibility across the entire probable trading range.
Bank Nifty sits right below it—because let’s be honest, half the action in Indian markets happens here. The tool calculates its complete pivot structure with all nine levels laid out identically, giving you the same comprehensive view.
Individual stocks appear in the list too. This means you’re not juggling multiple tools if you trade stocks alongside indices. Everything you need is calculated and displayed in one unified table.
Why Four Levels Instead of Three
Most traders are familiar with the standard three support and three resistance levels. So why does this calculator extend to S4 and R4?
Simple: extreme moves happen.
On volatile days—earnings announcements, budget reveals, global market shocks—prices don’t politely stop at S3 or R3. They blow through them like they’re not even there. Having S4 and R4 marked gives you reference points for those unusual sessions when the market truly breaks loose.
S4 becomes your “nuclear option” stop-loss zone. If the price is testing this level, you know something fundamental has shifted. Similarly, R4 represents the outer limit of possibility for that trading day—hit this, and you’re witnessing an exceptional move worth paying attention to.
For traders who’ve experienced those jaw-dropping gap-downs or euphoric rallies, you know exactly why having these extended levels matters. They’re not theoretical—they’re practical safeguards for when normal becomes abnormal.
The All-in-One-Table Advantage
Instead of calculating each instrument separately or switching between different pages, everything loads in a single table. You can scan Nifty, Bank Nifty, and your tracked stocks in seconds.
This matters more than it sounds. When you’re doing pre-market prep in the morning, you don’t want to be clicking around or waiting for multiple calculators to load. One table. All your levels. Done.
The layout is structured for quick reference: supports on the left progressing toward the pivot, resistances on the right extending upward. Your eye naturally moves from bearish territory through neutral to bullish zones.
Precision You Can Actually Use
Each level is calculated to two decimal points—no rounded approximations or “close enough” numbers. This precision matters when you’re setting exact stop-loss orders or limit entries. You’re not guessing where a level should be; you know the exact price point.
The calculation methodology follows standard pivot point formulas that institutional traders use globally: the pivot point derives from the previous session’s high, low, and close, while subsequent support and resistance levels build mathematically from that central pivot. Because these formulas are universal, the levels generated here align with what traders on professional terminals are watching.
Who Benefits Most from This Layout
Index traders switching between Nifty and Bank Nifty can compare both setups instantly. If Nifty is hugging a resistance while Bank Nifty is stuck at its pivot, that divergence tells you something about where money is flowing.
Stock traders who also keep an eye on the broader market get context without leaving the page. You’re analyzing a stock’s chart and wondering if that support will hold? A quick glance shows you whether the indices are also approaching support levels—which might explain the pressure.
Aggressive traders who target extended moves finally have the S4 and R4 levels built in. You’re not scrambling to calculate additional levels manually when the market gaps at open.
Multi-instrument traders save the mental overhead of running separate calculations. Whether you’re trading futures, options, or cash, your key levels for multiple instruments are sitting in one organized grid.
What Makes It Practical
No clutter. No ads obscuring half the table. No pop-ups asking you to subscribe. The tool does one thing and does it clearly: it calculates and displays your pivot levels in a format designed for traders who need information fast.
The date header means you’re never confused about which session you’re planning for. The consistent left-to-right flow from bearish to bullish levels creates a mental map you can internalize quickly.
And because it covers both major indices plus individual stocks, you can actually plan your entire trading strategy from one screen. Mark these levels on your charts, set your alerts, and you’ve got your framework before the opening bell even rings.
The Complete Coverage That Changes Your Workflow
Think about your typical morning routine: checking multiple sources, calculating levels for different instruments, trying to remember which number corresponds to which level. This tool collapses all of that into a single reference point.
You open one page. You see all your instruments listed vertically. Each row contains all nine pivot levels moving horizontally from maximum support to maximum resistance. The structure is identical for every instrument, so once you understand how to read one row, you can scan the entire table effortlessly.
This consistency matters when you’re making split-second decisions. Your brain doesn’t need to adjust to different layouts or hunt for information—it’s always in the same place, formatted the same way.
The Bottom Line on Nine Levels
That extra support and resistance level isn’t just padding. It’s insurance for the days when “impossible” moves happen—and in Indian markets, those days come more often than we’d like to admit.
When everyone else’s calculator stops at R3 and the price keeps climbing, you already know R4 is your next reference point. When a sharp sell-off pierces through S3 and traders are panicking, you’ve got S4 marked as your line of actual concern.
Fata Fat Nifty Levels’ Pivot Point Calculator gives you the complete picture: the standard levels everyone watches, plus the extreme zones that matter when volatility spikes. All organized in a single table that loads instantly and covers the instruments that actually matter to Indian traders.
It’s not flashy. It’s not complicated. It’s just genuinely useful—today, tomorrow, and every trading day after that.