

Open the FataFat Stock Screener app.
Most traders who use FataFat Stock Screener probably stumbled upon the Nifty% and BNifty% columns while scrolling through the Intraday Scan tab. These aren’t flashy additions, but they’re quietly useful if you trade F&O stocks and want a quick sense of how index heavyweights are behaving on any given day.
FataFat Stock Screener is a web-based tool that’s been around for a while, mainly used by intraday traders who need fast scans for breakouts, volume spikes, and pivot levels. It’s not a broker app—you still need Zerodha, Dhan, Fyers, or whoever you use for execution. Think of it as a pre-trade filter that sits alongside your terminal, helping you spot which stocks are showing strength or weakness before you even open a chart.
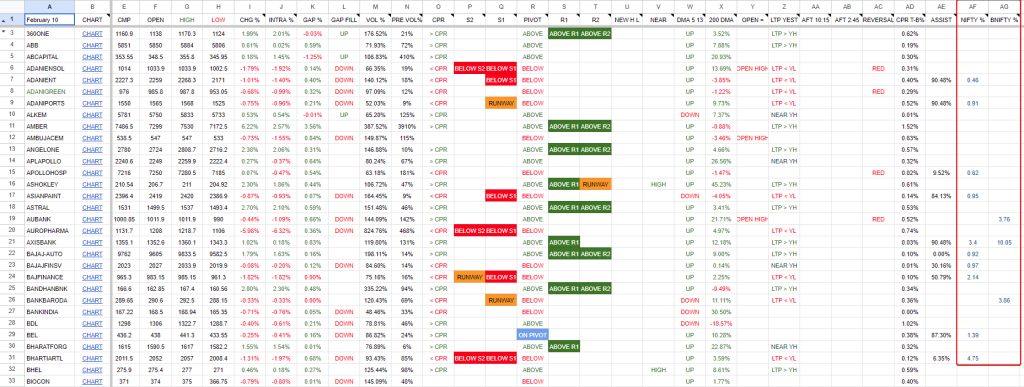
The Nifty% and BNifty% columns do exactly what their names suggest. Nifty% shows you which stocks are part of the Nifty50 index, and BNifty% does the same for BankNifty constituents. You can sort these columns by percentage change to see which index stocks are moving the most. The real utility comes when you cross-reference this with the other columns FataFat already shows—things like volume strength, intraday highs and lows, range breakouts, or whether a stock opened at its high or low.
For example, if Nifty is up 0.8% but you sort the Nifty% column and see that 35 out of 50 stocks are actually in the red, that tells you something about market breadth. Or if BankNifty is flat but HDFC Bank, ICICI Bank, and Kotak Bank are all showing strong volume and sitting near their intraday highs, you might read that as sectoral strength that hasn’t fully reflected in the index yet. It’s a quick sanity check before you decide whether to trade the index futures or pick individual stocks.
This feature is most useful for traders who are already watching index movements and want to understand what’s happening under the hood. If you’re someone who trades Bank Nifty options and wants to know whether the move is broad-based or driven by just two or three heavyweights, sorting the BNifty% column gives you that answer in seconds.
Who this feature is really for?
This feature on the Fatafat Stock screener is most relevant for:
- Intraday traders trading Nifty or Bank Nifty directionally
- Options traders who want quick clarity on index internals before taking positions
- Short-term momentum traders focusing on large-cap liquidity
Other screeners like TradingView let you create custom scans for index constituents, but they require you to set up the logic yourself. TradingView’s stock screener has an index membership filter, but neither surfaces this information as cleanly in a sortable table the way FataFat does. The difference here is being functional—FataFat Screener is built for traders who want to glance and go, not spend time configuring queries.
The feature is available on both the free and premium versions of FataFat Screener. If you’re already using the screener for intraday scans, the Nifty% and BNifty% columns are just sitting there in the Intraday Scan tab. You don’t need to toggle anything on or subscribe to a higher tier to access them.