Remember the first time you tried day trading and felt like you were throwing darts blindfolded? You’re not alone. While the pros seem to know exactly when to enter and exit positions, most retail traders struggle with one fundamental question: where’s the price actually headed today?
Enter pivot points—one of the oldest tricks in the trading playbook that’s gotten a serious fintech makeover.
What Makes Pivot Points Different?
Here’s the thing about pivot points: they’re refreshingly objective. While most technical indicators leave room for interpretation (looking at you, head-and-shoulders patterns), pivot points are pure math. You take yesterday’s high, low, and closing price, run them through a formula, and boom—you’ve got today’s potential support and resistance levels.
The standard formula is beautifully simple: Pivot Point (PP) = (High + Low + Close) / 3
From there, you calculate your support and resistance levels:
- R1 = (2 × PP) – Low
- S1 = (2 × PP) – High
- R2 = PP + (High – Low)
- S2 = PP – (High – Low)
But here’s what makes this powerful: thousands of traders are watching these same levels. It becomes a self-fulfilling prophecy of sorts—when everyone’s eyeing R1 as a potential ceiling, guess what often happens there?
Popular Pivot Point Strategies for Intraday Traders
1. Reading Market Bias: Trading Above or Below the Pivot
The simplest—and most underrated—way to use pivot points is as a directional compass for your trading day.
When price holds above the pivot point, the bulls are running the show. But here’s the nuance most traders miss: this isn’t your cue to start chasing green candles. Instead, you’re waiting for pullbacks. Price often gravitates back toward the pivot like it’s tethered by an invisible string. When it touches that level and bounces with conviction, you’ve just watched the pivot transform into intraday support—and that’s where your long setups live.
When price trades below the pivot, the bears own the narrative. Now every rally becomes suspect. Watch how price behaves when it climbs back toward the pivot—it tends to attract sellers like moths to a flame. This is your zone for short setups, assuming the level holds. Sure, dramatic reversals happen, but trying to catch them without solid confirmation is how accounts get bruised.
Think of the pivot point as the market’s daily referendum on sentiment. It’s the line in the sand that separates conviction from confusion. By identifying which side price is defending, you’re not just reading the market—you’re aligning yourself with the path of least resistance. And in intraday trading, that alignment is the difference between swimming with the current and exhausting yourself fighting the tide.
2. Range-Bound Trading: The S1-to-R1 Corridor
Here’s what nobody tells you about choppy, low-volatility days: they’re actually goldmines if you know what you’re doing. When the market’s not trending, price tends to ping-pong between S1 and R1 like it’s trapped in an invisible box.
The play is straightforward:
- Hunt for longs near S1 when you see bullish confirmation—maybe a hammer candle, a volume spike, or RSI climbing out of oversold territory
- Look for shorts near R1 when bearish signals appear—rejection wicks, declining volume on the push up, or momentum indicators rolling over
The central pivot becomes your checkpoint. If price keeps drifting back to it throughout the session, you’re not in a trending environment—you’re in a consolidation zone. Adjust your expectations accordingly. This isn’t the day for home runs; it’s the day for consistent base hits between the boundaries.
3. Breakout Trades: When the Cage Breaks
Sometimes price doesn’t respect the boundaries. It blows through R1 or crashes below S1 right out of the gate and just keeps running. These are your momentum days, and they demand a different mindset.
But here’s the trap: not every break is real. Experienced traders have learned to be skeptical. They wait for three things before pulling the trigger:
A clean retest of the broken level—if price breaks above R1, they want to see it come back and hold R1 as new support before going long
Volume that means business—thin, half-hearted breakouts get faded mercilessly; you want to see participation that suggests institutional interest
Confirmation from the broader market—is the SPY or sector ETF confirming this move, or is your stock acting weird in isolation?
This patience filters out the head-fakes that blow up accounts. A true breakout with volume backing and a successful retest? That’s when you can size up with confidence. Everything else is just noise trying to separate you from your capital.
Making It Work For You


Start simple. Before placing your first trade, get familiar with how pivot points behave in live market conditions.
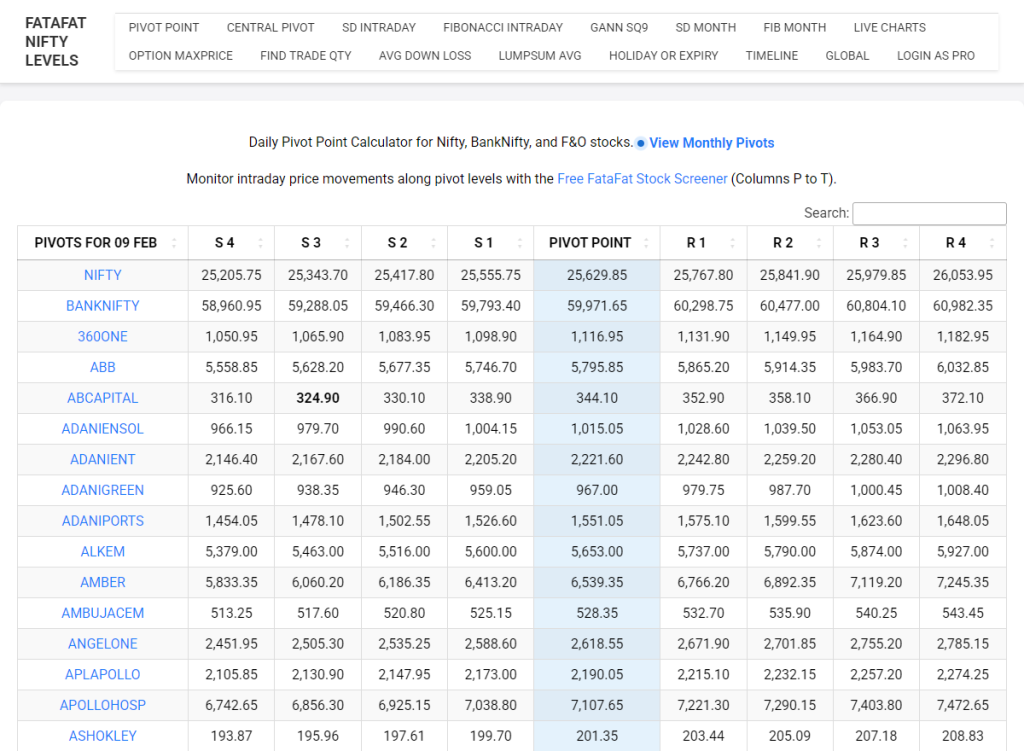
Use a automated pivot point calculator like FataFat Nifty Levels—it does the math for you, no spreadsheets required. Pull up the levels for your instrument, plot them on your chart, and then just watch.
Here’s the key: don’t trade for at least a week. Just observe. Does price respect S1 or slice through it? Does R1 act as resistance during choppy sessions? You’ll spot patterns specific to what you’re trading, and those insights are worth more than any cookie-cutter strategy.
When you’re ready to trade, set alerts at key levels instead of staring at screens all day. Let your phone ping you when price approaches R1 or tests the pivot. Check the setup, make your decision, move on.
This is fintech working for you: the calculator handles the math, alerts handle the monitoring, and you handle the execution. That’s how you build a sustainable edge without burning out.
The Bottom Line
Pivot points won’t make you rich overnight, but they provide structure in the chaos of intraday trading. They’re objective reference points in a subjective game, and with today’s automated calculators and alert systems, they’re more accessible than ever.
The best part? While everyone else is chasing hot stock tips on social media, you’ll have a systematic approach based on actual price action. And in trading, that systematic edge is worth its weight in Bitcoin.
Just remember: tools are only as good as the trader using them. Master the basics, respect your risk management rules, and let the pivot points guide you—not dictate your every move.