

You’ve been using TradingView for charts and analysis for a while now. Your actual trades, though, live somewhere else. They’re in your broker’s platform, scattered across export files, or manually noted in a spreadsheet. The gap between where you analyze and where you actually track your performance is exactly the problem TradingView Portfolios is designed to close.
The fastest way to get your full trade history into TradingView Portfolios is through a CSV import. Once it’s done, every metric the platform calculates, including your benchmark comparison, beta, Sharpe ratio, Sortino ratio, and sector allocation, is based on your real transaction history and not on estimates or manual entries. This guide walks through how to do it correctly and what to watch out for.
The Three Ways to Create a Portfolio
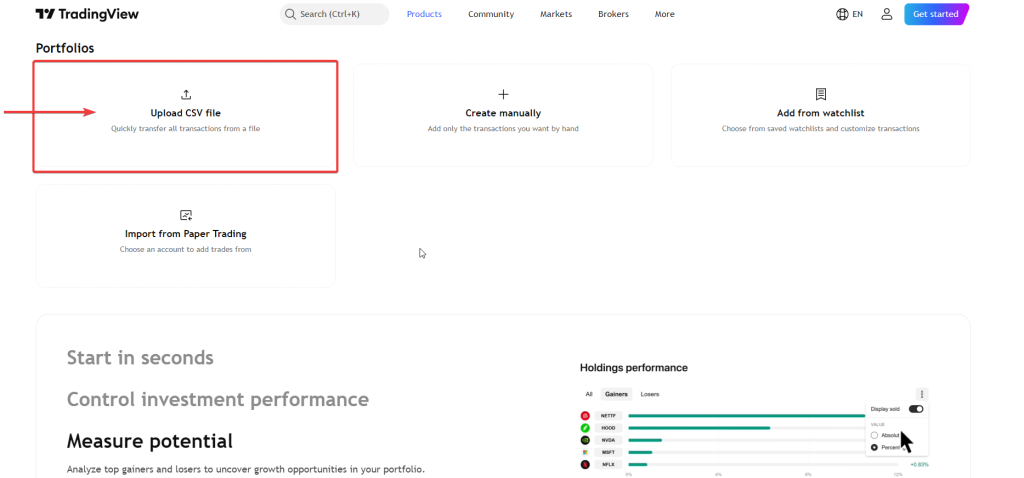
When you first go to the Portfolios section under the Products menu on TradingView, you’ll see three options for getting started: importing a CSV file, adding transactions manually one by one, or pulling data from an existing TradingView watchlist.
The watchlist method is quick but limited. It only captures your current holdings as a snapshot. It doesn’t know when you bought, at what price, or what you’ve sold in the past. The manual entry method gives you precise control but is time-consuming if you have more than a handful of trades. For anyone with an established trading history, the CSV import is the right starting point.
What the CSV File Needs to Look Like
TradingView supports one specific CSV format for transaction imports. The file must use commas as the delimiter and must include a header row. The required fields are:
Symbol: the instrument in exchange:ticker format. For example, NASDAQ:AAPL or BYBIT:BTCUSDT. Cash transactions use $CASH as the symbol.
Side: either buy or sell.
Qty: the number of units. Always enter units, not lots, even if your broker quotes the instrument in lots.
Fill Price: the price at which the transaction was executed.
Commission: the fee paid. This can be 0 if there was no commission, but the field must still be present.
Closing Time: the date and time of the transaction.
TradingView provides a downloadable example file directly inside the import window if you want to check the exact formatting before preparing your own. If there are formatting errors in your file, the import will show you the specific line where the issue occurred and nothing will be added until it’s corrected, so there’s no partial import problem to deal with.
Getting the Export from Your Broker
Most brokers offer a transaction history export somewhere in the account or reporting section of their platform. The terminology varies. It might be called trade history, order history, closed positions, or account statement. You’re looking for a file that contains at minimum the symbol, direction (buy/sell), quantity, execution price, fees, and date for every trade.
The exported format from your broker almost certainly won’t match TradingView’s required format out of the box. You’ll need to reformat it, typically in a spreadsheet. The work involved is usually one column mapping exercise per broker, and once you’ve done it once for a given platform, future exports follow the same pattern.
A few things to handle during this step. First, make sure your symbols are in the exchange:ticker format TradingView expects. Second, check that quantities are in units rather than lots. Third, confirm the date format is consistent throughout. These are the most common causes of import errors.
Setting Up the Portfolio Settings Before You Import
When you choose to create a portfolio via CSV import, the setup window asks you for three things before you upload your file: the portfolio name, the base currency, and the benchmark.
The base currency matters because TradingView will convert all your asset values into this currency. If you hold assets traded in multiple currencies, they’ll all be unified into the one you choose here. You cannot change the base currency after the portfolio is created, so pick the one that reflects how you think about your total wealth.
The benchmark is the index or instrument your portfolio’s performance will be compared against. This is worth thinking about for a moment. If you trade a broad mix of equities, a broad market index makes sense. If your portfolio is concentrated in a specific sector or in crypto, a benchmark that reflects that market gives you a more meaningful comparison. You can use any symbol TradingView supports as a benchmark and it doesn’t have to be a traditional index.
The risk-free rate feeds into the Sharpe and Sortino ratio calculations. This is the theoretical return you could earn with essentially no risk, typically based on short-term government bond yields or deposit rates. Setting it to something in the right ballpark matters for those metrics to be meaningful.
What Happens After the Import
Once your file uploads successfully, TradingView confirms the number of transactions added and builds the portfolio. From there, the Overview tab gives you your total portfolio value, unrealized gain, total gain, and annualized yield right at the top.
The Performance chart shows two lines when you switch to Performance view: your portfolio and your benchmark, both calculated from the same cash flow timeline. This is a proper apples-to-apples comparison because TradingView creates a virtual parallel portfolio that mirrors the timing of your actual buys and sells, but using the benchmark instead of your holdings. When you bought on a particular date, the system also virtually bought the benchmark for the same amount. The resulting comparison reflects whether your stock picking actually added value, not just whether the market went up.
The Analysis tab is where the risk metrics live. Beta tells you how much your portfolio moves relative to the benchmark. The Sharpe Ratio measures how much return you’re generating per unit of total volatility, with values above 1.0 generally considered solid and above 2.0 excellent. The Sortino Ratio refines this by measuring only downside risk rather than all volatility, which is arguably the more honest view of what risk actually means to an investor.
Adding to the Portfolio Over Time
After the initial import, new trades can be added in two ways. You can import another CSV file through the Transactions tab, and by default the new transactions merge with the existing history rather than replacing it. Or you can add individual transactions manually through the Add Transaction button, which is practical for keeping the portfolio current on an ongoing basis without re-exporting your entire broker history each time.
TradingView also supports adding dividend transactions, deposits, withdrawals, and tax or fee transactions separately. Recording dividends matters because they affect your realized gain calculations and overall return figures. Leaving them out understates what the portfolio actually generated, which in turn makes your Sharpe and Sortino ratios look worse than they should.
Free vs Paid Limits
On the free plan, you can manage one portfolio with up to 20 holdings and 2,000 transactions. Paid plans expand this significantly, starting at 3 portfolios and 50 holdings on Essential, scaling up to 7 portfolios and 150 holdings on higher tiers. All paid plans support 5,000 transactions per portfolio. For traders building a complete multi-year transaction history across a reasonable number of positions, the paid tier is worth checking. There’s a 30-day free trial available on paid plans through TradingView’s pricing page.
If your broker history is sitting in a downloaded file somewhere and you’ve never actually analyzed how your overall strategy has performed, the CSV import into TradingView Portfolios is the fastest way to change that. The setup takes less time than most people expect, and the benchmark comparison alone tends to be a fairly revealing exercise.