

W.D. Gann was an early twentieth century trader who developed analytical methods based on geometry and the idea that price moves in repeating, mathematically predictable cycles. His Square of 9 maps price values onto a spiral grid, and the key observation is that prices tend to react at levels separated by specific angular distances on that spiral, with the 45-degree angle being the most significant. That single concept is what this calculator is built around.
[Open the Gann Square of 9 Calculator here]
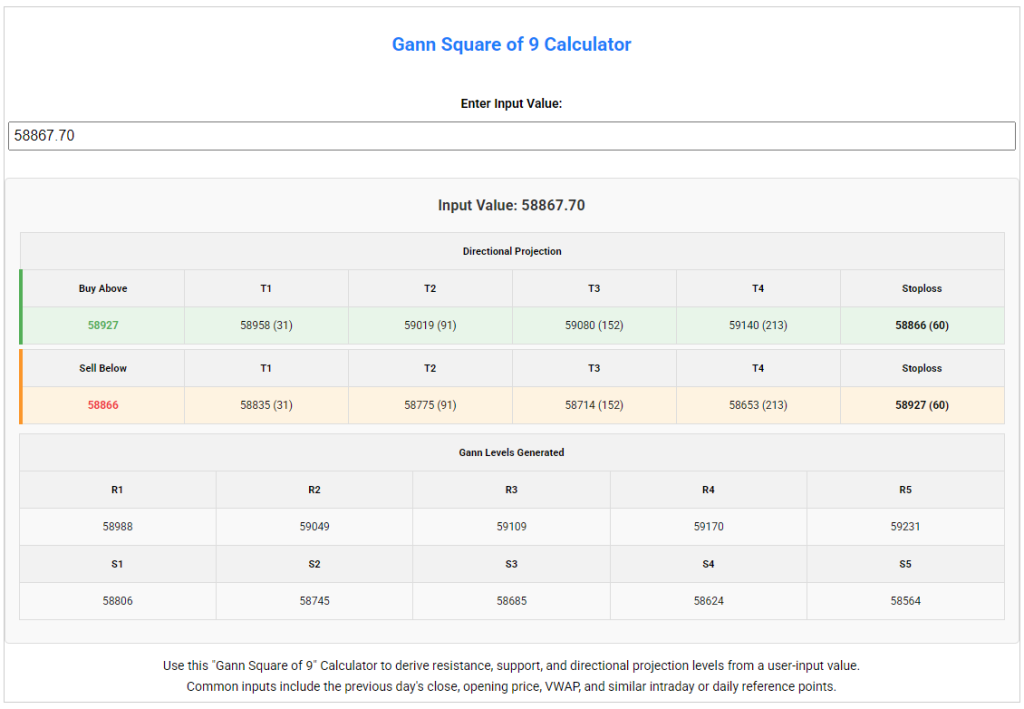
What the Calculator Takes as Input
The calculator asks for one number, the Input Value. This is a price reference point you want to analyse. Common choices are the previous day’s closing price, the session’s opening price, or any significant level like a VWAP. Once you enter a value, the calculator updates automatically and displays two tables.
Directional Projection: The 45-Degree Angle
This is the first table and the one most users are here for. It gives you a Buy Above level and a Sell Below level, four targets for each direction, and a stoploss on each side. The core idea is straightforward: your input price generates two threshold levels, one above and one below. Where the market is trading relative to those two thresholds is what the Square of 9 uses to define directional context.
Using the Buy Above Level
The Buy Above level is the upper threshold derived from your input. When the market is trading above this level, the Square of 9 considers price to be in geometrically positive territory for that reference point. The practical way to use it is to treat it as a confirmation line rather than an entry trigger in itself.
If price opens above the Buy Above level, or moves up through it during the session and holds, the targets on the buy side become the levels worth watching as the session progresses. T1 is the nearest target, and price will often pause or show some reaction there before deciding whether to continue. T2, T3, and T4 are progressively further out and come into play when the move has momentum behind it. The stoploss on the buy side is the level that tells you the reading has broken down, and price has slipped back into neutral or negative geometric territory.
A common approach is to wait for price to be comfortably above the Buy Above level rather than reacting the moment it crosses. A level that is holding above the threshold on multiple checks through the session carries more weight than a brief spike through it.
Using the Sell Below Level
The Sell Below level works as the mirror image. When the market is trading below this level, the Square of 9 considers price to be in geometrically weak territory. The four sell-side targets (T1 through T4) then become the levels to watch on the downside, with T1 again being the nearest and T4 the furthest extended move.
The stoploss on the sell side marks the price above which the bearish geometric reading would no longer hold. As with the buy side, a market that is sitting comfortably below the Sell Below level through the session is a stronger reading than one that has only briefly dipped under it.
The Zone Between the Two Levels
It is worth paying attention to what happens when price is trading between the Buy Above and the Sell Below levels. This middle zone represents geometric indecision on the Square of 9. Neither the buy side nor the sell side is confirmed, and the targets on both sides are effectively on hold. Many experienced users of this method treat this zone as a range and wait for price to resolve clearly to one side before drawing any directional conclusion from the calculator’s output. A break above the Buy Above level activates the buy-side targets. A break below the Sell Below level activates the sell-side targets. Until one of those happens, the output of the directional table is best treated as a map of potential levels rather than an active read.
Gann Levels: Resistance and Support
The second table shows five resistance levels above your input (R1 through R5) and five support levels below it (S1 through S5). These are spaced at roughly 45-degree intervals along the spiral outward from your reference price, so each level is geometrically derived rather than based on a fixed percentage or point move.
R1 is the nearest resistance, R5 the furthest. S1 is the nearest support, S5 the furthest. These give you the full map of significant levels surrounding your input price.
Reading the Two Tables Together
The Directional Projection tells you which side is geometrically active. The Gann Levels give you the broader map. Where a target from the first table coincides with a level from the second, that price becomes more notable simply because two separate parts of the Square of 9 are pointing to the same area.
A practical starting point is to apply the calculator to a few past sessions using historical closing prices, and observe how price behaved around the projected levels. That gives you a feel for how the geometry plays out before incorporating it into any live workflow.
The calculator is a structured way to identify levels worth watching. Used that way, it is a clean application of one of Gann’s most enduring geometric ideas.