

When a stock you hold drops below your purchase price, one question that often comes up is: if I buy more shares at the current price, what will my new average cost per share be? Working this out manually, especially across multiple purchase lots, takes longer than it should. The Stock Averaging Down Calculator handles that arithmetic for you, giving you the numbers in seconds.
This walkthrough explains what each input means, how the tool calculates its output, and what you’re actually looking at when the results appear.
What Averaging Down Means
Averaging down refers to purchasing additional shares of a stock at a price lower than your original average cost. Because the new shares are bought at a lower price, they pull the overall average cost per share downward. The resulting figure is a weighted average across all the shares you hold, old and new combined.
The calculation itself is straightforward in principle: total amount invested divided by total shares held. Where it gets fiddly is when you want to work backwards from a specific target average to figure out how many shares you’d need to buy to get there. That’s the problem this tool solves.
The Four Inputs
Shares in Holdings
This is the number of shares you currently own. Enter the total quantity across all your previous purchases of that particular stock. Your broker’s portfolio view will have this figure.
Average Cost per Share (₹)
This is the weighted average price you paid per share across all your previous purchases. If you bought at different prices over time, the broker platform calculates and displays this for you, usually labeled as “average cost,” “average buy price,” or “cost basis per share.” Use that number here.
Current Market Price per Share (₹)
The price at which the stock is trading at the time you’re running the calculation. This is the price used to work out how many additional shares would need to be purchased.
Targeted Average Price per Share (₹)
This is the average cost per share you want to end up with after the additional purchase. It must be somewhere between the current market price and your existing average cost, since buying at a lower price is what brings the average down. The tool uses this target to calculate the required share quantity.
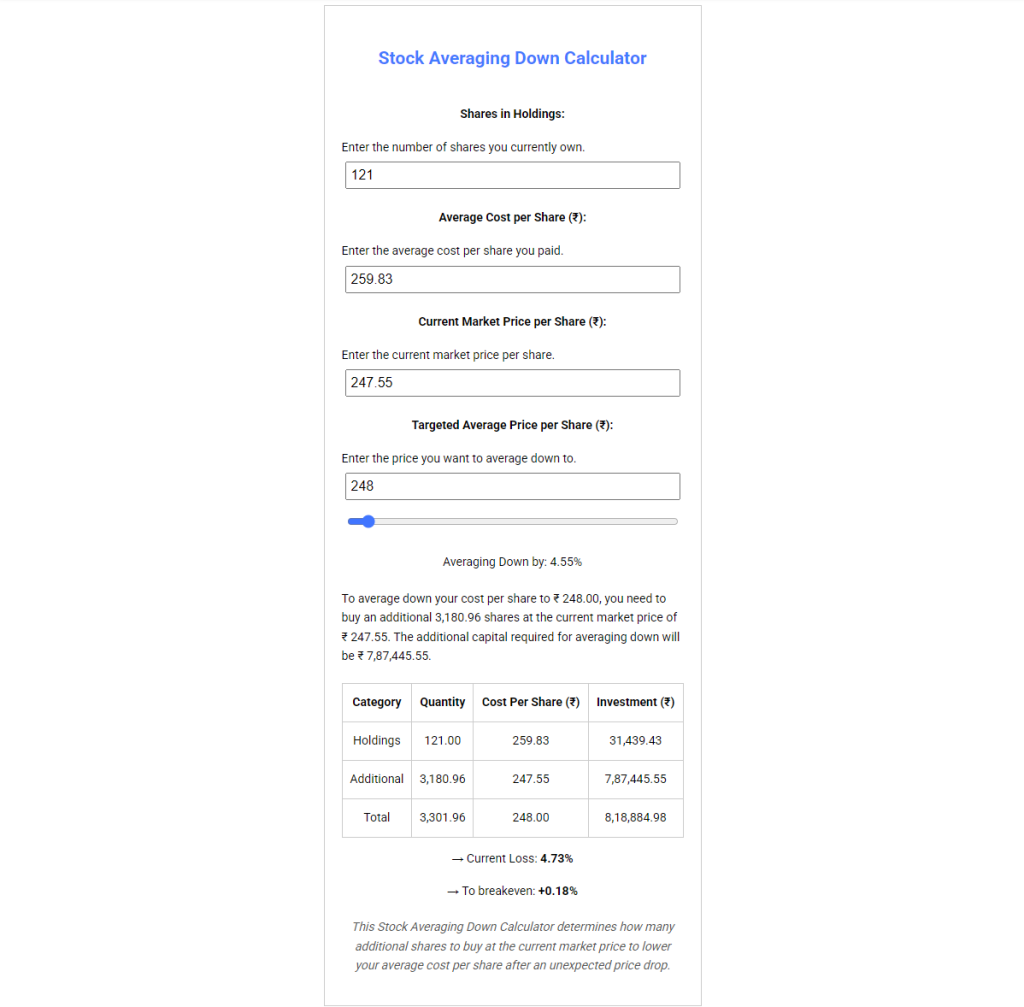
Walking Through an Example
Using the default values already loaded in the calculator:
- Shares in Holdings: 121
- Average Cost per Share: ₹259.83
- Current Market Price: ₹247.55
- Targeted Average: ₹248.00
The calculator works out how many additional shares, bought at ₹247.55, are needed so that the combined average across all shares held comes out to ₹248.00. It shows that number, along with the total cost of the additional purchase and the updated overall investment figure.
Changing the target average changes the output. A lower target means more shares are needed to pull the average down further. A target close to the current market price requires a larger purchase than a target closer to the original average.
The Slider
Below the input fields there is a price slider. It covers the range between the current market price and the existing average cost, and it controls the Targeted Average field. Dragging it left or right adjusts the target and immediately updates the results.
The “Averaging Down by: X%” label below the slider shows the percentage reduction between the original average cost and the selected target. This updates live as the slider moves, so you can see different scenarios side by side without typing new numbers each time.
What the Output Shows
Once the inputs are filled in, the results section displays:
- The number of additional shares to buy at the current price
- The total cost of that purchase
- The resulting new average cost per share
- The total capital invested across original and new shares combined
Two percentage figures also appear in the output and are worth understanding clearly.
Current Loss
This shows how far the current market price has fallen from your original average cost, expressed as a percentage. Using the example values: the original average cost is ₹259.83 and the current price is ₹247.55, so the current loss is (259.83 – 247.55) / 259.83 = 4.73%. It is simply a measure of the gap between what you paid and where the stock is trading now. It does not change when you adjust the target average, since it only reflects the difference between the two prices you entered.
To Breakeven
This shows the percentage the current market price would need to rise to reach your targeted average after the additional purchase. Using the same example: the targeted average is ₹248.00 and the current price is ₹247.55, so the stock would need to move up (248.00 – 247.55) / 247.55 = 0.18% from its current level to reach that target. As you adjust the targeted average upward, this figure increases, because a higher target requires a larger price move to reach it.
These are purely mathematical outputs based on the numbers entered. They reflect what the arithmetic produces given the inputs, nothing more.
A Note on the Price Input
The current market price changes throughout the trading day. The calculator uses whatever figure you type into that field, so the output is only as current as the price you enter. For a more accurate calculation, use a live quote at the time you’re running the numbers.
Who the Tool Is Built For
The calculator uses the Indian rupee (₹) as its currency and is aimed at investors on Indian exchanges. That said, the underlying math applies to any stock in any market. The currency symbol is cosmetic; the calculation works the same regardless of the currency your shares are priced in.
The tool requires no sign-up and stores no data. All calculations happen in the browser. It is accessible at fatafatniftylevels.in/averagedown.php and works on both desktop and mobile.