For a long time, the conversation around mStock by Mirae Asset has been fairly one-dimensional: it is an excellent choice for saving on brokerage, but the trading interface often felt a step behind the industry leaders. Active traders generally had to choose between the cost savings of mStock’s zero-brokerage model and the superior charting tools offered by other tech-first platforms.
The recent integration of the TradingView chart library into mStock’s web platform looks to bridge that gap. This isn’t just a cosmetic upgrade to the way candles look; it is a functional shift in how users interact with the market. For those who found the previous in-house charting tools restrictive, this update brings mStock closer to the standard expected by serious technical analysts in India.
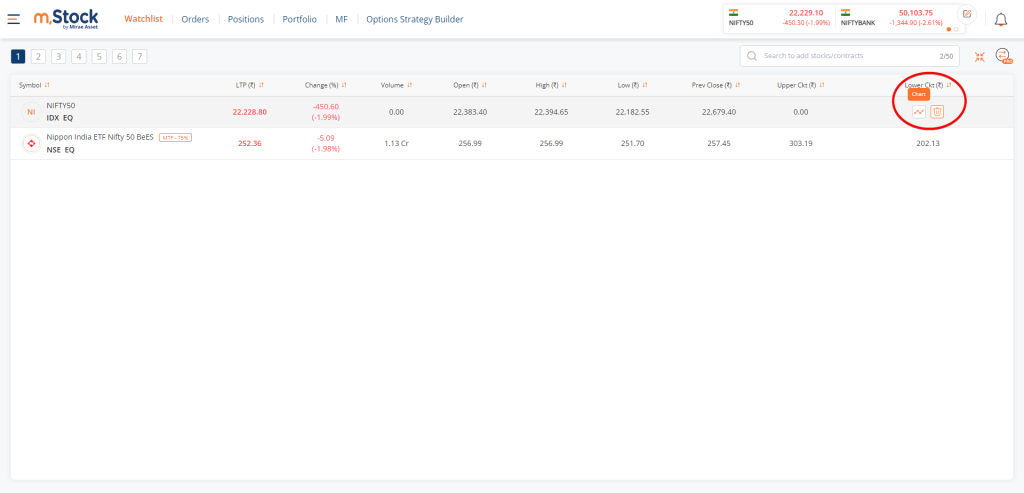


If you log into the mStock web portal now, the default charting experience has been overhauled. Instead of the older proprietary charts, you can now use the familiar TradingView charting library. The update goes beyond just displaying cleaner price action and adding more indicators. The core operational change here is the ability to place, track, and modify your trades directly from the chart window.
Mechanically, this means you no longer have to open a separate order panel, type in your price limits, and constantly check your positions tab to see if a trade triggered. When you spot a setup forming on the chart, you can simply interact with the Buy Sell buttons on the chart to place a buy or sell order. Once the order is live, it appears as a horizontal line mapped directly on the candlestick chart. If you need to adjust your stop-loss or take-profit levels because the price action is getting choppy, you just drag those lines up or down on the screen.
This kind of workflow is a strict requirement for certain trading styles. Scalpers and momentum day traders operate on tight timeframes where looking away from the chart to fill out an order ticket can mean missing the entry point entirely. Visualizing exactly where your stop-loss sits relative to a recent swing low, without having to calculate the exact rupee value in your head, removes a significant amount of cognitive load during live market hours.
This update makes mStock a much more viable option for high-volume intraday traders. When you pair a highly visual, fast-execution interface like TradingView with heavily discounted brokerage models, such as a minimal flat fee per trade or a one-time account fee, the value proposition becomes quite strong. Active traders often bleed capital through standard 20-rupee order fees. Lowering execution costs while maintaining access to premium charting mechanics is an effective way to protect profit margins.
If you are a long-term investor who primarily logs in to buy a few delivery shares or index funds every month, this update will not change your routine. The standard order window works perfectly fine for passive investing. However, for users who previously opened an mStock account for the low fees but abandoned it because the in-house charts were frustrating to navigate, this integration warrants a second look.
It is worth noting that mStock is catching up to the industry standard here rather than inventing something new. Competing discount brokers like Dhan, Fyers, and Zerodha have offered deep TradingView integrations for quite some time, setting a high baseline for what Indian retail traders expect. mStock adding this feature closes a significant usability gap between them and those top-tier platforms.
Even with these native broker upgrades, many serious market participants still run separate, dedicated charting applications or market screeners on a secondary monitor for heavy technical lifting, using the broker’s web platform purely for final execution. Having the TradingView library as a charting option for mstock simply makes that final execution phase much smoother and far less prone to manual data entry errors.