

Ghost Candles is a forward-projection indicator available on TradingView’s public script library that attempts to visualize potential future price behavior before it happens. Rather than reacting to historical price data like most traditional indicators, it renders up to 32 semi-transparent “ghost” candles directly ahead of the current bar, giving traders a visual representation of where price may move next.
https://in.tradingview.com/v/pgBOEG3h/
What It Does
The indicator places a sequence of forward-looking candles on your chart that evolve continuously as new market data comes in. These projections are not static. A projection visible at one moment may look noticeably different minutes later as new bars form and the model updates itself.
The tool is designed to help traders:
- Anticipate short-term directional bias
- Identify potential continuation or reversal scenarios
- Spot price compression ahead of expansion moves
- Gauge momentum build-up or market hesitation
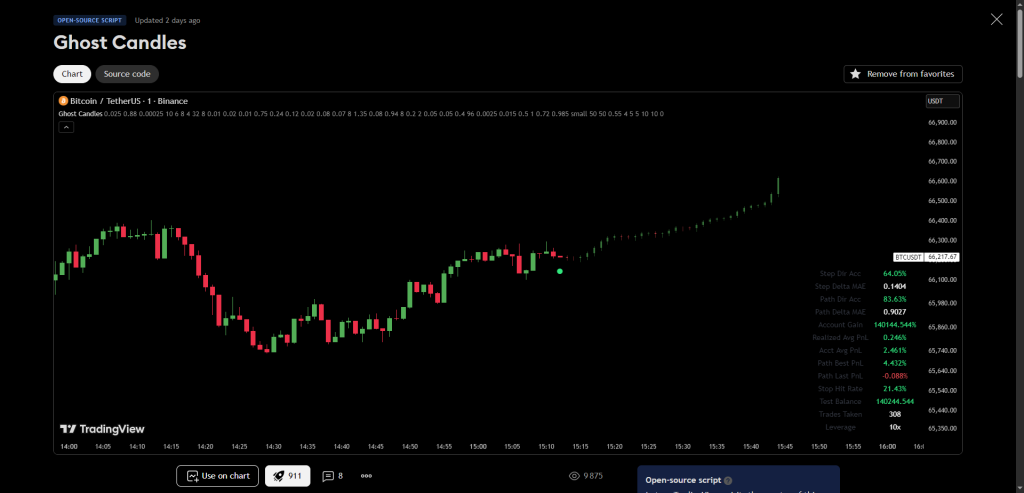
Beyond the visual projection, Ghost Candles also includes a performance evaluation table that compares its directional accuracy against a randomly trading baseline algorithm, giving users some reference point for how the model is performing in current market conditions. Red and green dot signals are placed at the projected candles the model considers most significant, and a backtesting module allows users to simulate performance using configurable leverage and stop loss settings.
How It Claims to Work
According to the author, Ghost Candles is powered by a lightweight neural network that trains itself directly on the chart, updating every bar without relying on any external data source. The model draws on real-time order-flow proxies, volatility measures, and multi-timeframe price features to generate its forward projections.
The Neural Network Claim: Read This First
This is where a degree of skepticism is warranted. TradingView’s Pine Script language, the environment in which this indicator is built, carries strict computational limitations. Implementing a neural network with genuine predictive capability inside those constraints is not realistically achievable in any meaningful technical sense.
What the indicator most likely does in practice is apply weighted mathematical calculations derived from price, volatility, and momentum data and project those forward in a visual candle format. Describing this as a neural network may reflect the author’s chosen framing rather than an accurate technical description of the underlying mechanics. This does not necessarily make the tool useless, but traders should understand what they are actually working with.
A Fast-Moving Development Cycle
Ghost Candles accumulated more than 30 update cycles within its first three days of publication. Changes included multiple hyperparameter overhauls, sensitivity adjustments, wick size modifications, directional accuracy rewrites, new backtesting features, and various visual and scaling improvements.
This level of rapid iteration is worth paying attention to. When an indicator undergoes constant parameter changes shortly after release, it typically signals that the author is adjusting outputs reactively, refining the appearance of results rather than validating a stable underlying model. This is a common pattern in TradingView’s community script library.
Until the development pace settles and the model demonstrates consistency across a meaningful sample of market conditions, users should treat the indicator as a work in progress rather than a finished tool.
Using It Responsibly
The author is upfront about the indicator’s limitations. Ghost Candles is described as experimental and predictive, not deterministic, and is recommended as a contextual tool rather than a standalone signal generator. Because projections shift continuously as new data arrives, past projections cannot be reviewed or validated in any traditional backtesting sense.
The author recommends pairing it with:
- Market structure analysis covering key levels, swing highs and lows, and trend context
- Liquidity identification in areas where orders are likely clustered
- Confirmation tools for entries based on additional technical confluence
Used without supporting analysis, the fluid nature of the projections makes it difficult to build a consistent or rules-based trading approach around the indicator alone.
Who It Is Most Relevant For
Ghost Candles will likely appeal most to price action traders and short-term intraday traders who already work with directional bias, session structure, and momentum-based setups. The visual format is intuitive and the concept of seeing a projected path ahead of price has practical appeal for traders making quick decisions in fast-moving markets.
It is less relevant for purely indicator-driven traders, longer-term swing or positional traders, or anyone looking for a mechanical, rules-based system with a verifiable edge.
Bottom Line
Ghost Candles is a conceptually ambitious indicator that pushes against the realistic boundaries of what TradingView’s Pine Script environment can deliver. The forward-projection format is visually compelling and the inclusion of accuracy tracking and backtesting adds a layer of transparency not always seen in community scripts.
That said, the neural network claims warrant healthy skepticism, the indicator is still in a very early and unstable stage of development, and the continuously shifting projections are inherently difficult to validate in any rigorous way.
It is worth exploring as a supplementary visual aid for directional context. It should not be relied upon as a forecasting engine until a stable version exists and independent performance data is available.
This article is for informational purposes only and does not constitute financial advice.