

If you’re an active trader scanning for quick opportunities at market open, you might have missed the gap scanning feature in the Fatafat Stock Screener. It’s tucked away in the Intraday Scan Tab (Column K), quietly helping traders spot open gaps in NSE’s F&O underlying stocks. While it’s not a new feature, it’s one of those tools that often goes unnoticed until someone points it out—so here’s your reminder.
For those unfamiliar, the Fatafat Stock Screener is a web-based app that’s been around for a bit, primarily focusing on helping retail traders quickly scan for specific conditions in the market. It’s not a full-fledged trading platform, but rather a utility for identifying potential trade setups based on technical parameters.
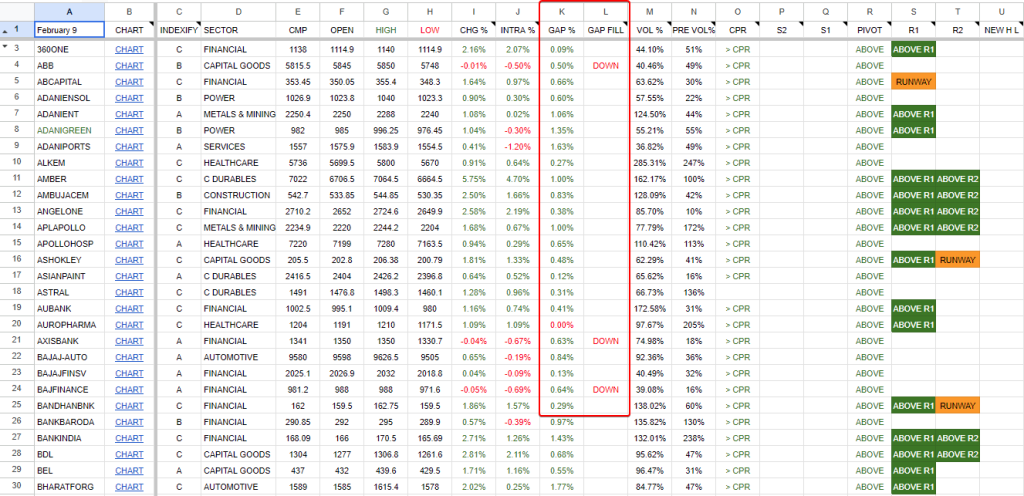
Now, about the feature itself. If you head over to the Fatafat Stock Screener homepage and open the app, you’ll find an “Intraday Scan” tab. Within that tab, specifically in “Column K,” there’s a scanner dedicated to identifying open gaps in F&O underlying stocks on the NSE. What this means is, at the start of the day or even during market hours, you can quickly see which F&O stocks have opened with a significant price difference from their previous close. This can be crucial information for intraday strategies, as opening gaps often set the tone for the day’s movement, sometimes indicating strong sentiment or significant overnight news.
But here’s where it gets a bit more interesting for those of us tracking these movements. Right next to the open gap scanner, in “Column L,” the Fatafat Stock Screener also offers a “gap fill” scanning feature. This is pretty useful because, as many experienced traders know, gaps have a tendency to fill. A gap fill occurs when the price action during the day retraces to cover the area of the initial gap. Identifying stocks where an opening gap is starting to fade and potentially fill can offer reversal opportunities or confirmation of momentum exhaustion. It’s a classic setup many intraday traders keep an eye on.
So, who is this feature really for? Primarily, active intraday traders who focus on F&O segments will find this most beneficial. If you’re someone who scans for quick momentum plays or mean reversion setups based on opening price action, having a dedicated scanner for gaps and gap fills can save you time. Instead of manually sifting through charts or relying solely on your broker’s limited scanning capabilities, Fatafat Stock Screener lets you quickly filter for these specific conditions. It’s particularly handy for those looking to identify stocks that have opened strong but are showing signs of weakness, or vice-versa.
Long-term investors or those primarily involved in positional trading might not find this particular feature as critical. Their focus is generally on broader market trends, fundamental analysis, or swing trades over longer durations, where intraday gaps play a lesser role. However, even for them, understanding the daily price dynamics of their holdings can offer useful context.
While most major brokers like Zerodha, Groww, Upstox, and Angel One offer various screening tools, and platforms like TradingView provide extensive charting capabilities to identify gaps, a free, standalone tool focused specifically on these two gap-related parameters for NSE F&O stocks is a nice addition to a trader’s arsenal. It’s not about replacing your primary broker platform or TradingView, but rather complementing them. Many of us use a combination of tools – our broker for execution, TradingView for advanced charting, and perhaps a dedicated screener like Fatafat Stock Screener for specific, quick scans.
In essence, if you’re an Indian retail trader who regularly looks for intraday opportunities based on gap theory, the Fatafat Stock Screener’s gap and gap-fill scanner in the Intraday Scan tab is worth a look. It’s a simple, free reminder that sometimes, the most useful tools are the ones that do one thing well and efficiently.