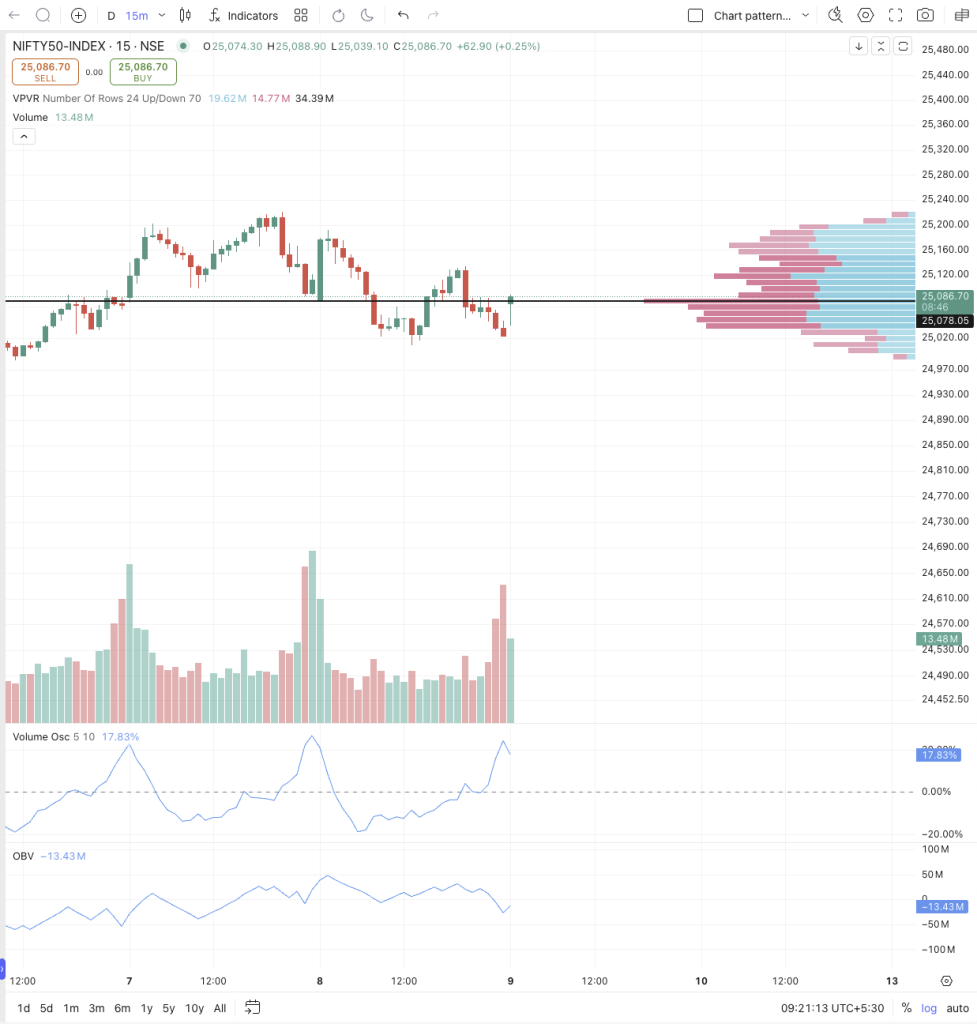
[Image courtesy of Fyers.]
The Indian fintech landscape is continually evolving, and a recent enhancement from leading stock brokers and fintech app providers is set to significantly empower traders: the introduction of real-time volume data for key indices such as Nifty50 and Bank Nifty. This development marks a substantial step forward in providing more comprehensive analytical tools for market participants.
Previously, while volume data was readily available for individual stocks, it was largely absent for major indices. This new feature addresses that gap by displaying the cumulative volume of all underlying stocks directly on the index charts. This innovative approach provides a clearer picture of the actual participation and strength behind index price movements. For traders and investors in the Indian stock market, understanding index volume data is crucial. It offers vital context, helping to assess the conviction of trends and potential reversals in broader market segments like the Nifty50 and Bank Nifty.
With Nifty Bank volume data and Nifty 50 volume data now integrated into trading platforms, users can leverage advanced technical analysis tools directly on index charts. This includes applying indicators such as Volume Weighted Average Price (VWAP) and Volume Profile, which were previously limited to individual scrips. The ability to conduct volume-based analysis on indices offers deeper insights into market dynamics, aiding in more informed decision-making for entries and exits. This enhancement caters to both seasoned traders seeking to refine their strategies and those new to fintech trading India, by simplifying complex market signals into actionable intelligence.
This feature represents a significant upgrade for Indian trading platforms, bringing them closer to global standards in terms of analytical depth. By providing transparent and rules-based calculation methodologies for index volume, based on the sum of the trading volumes of all index components, these platforms ensure consistency across various timeframes. This move underscores a commitment to equipping investors with robust stock market analysis tools for a more nuanced understanding of the market.
Fyers Leads the Way with Volume Data Integration
Fyers, a prominent trading platform in India, has recently announced the availability of volume data on index charts. This feature, highlighted in their community blog, allows traders to analyze indices such as Nifty50 and Bank Nifty with greater precision. With this update, Fyers aims to enhance the trading experience, offering users a competitive edge in the markets. You can learn more about this feature on Fyers’ community blog.
Dhan Also Launches Index Volumes on Charts
Following suit, Dhan, another leading trading platform, has also integrated index volumes into their charts. This feature, discussed on their community forum, enables traders to access real-time volume data for indices, facilitating better decision-making. Dhan’s move to incorporate this data is a testament to their commitment to providing traders with comprehensive tools for market analysis.
TradingView’s Native Charting Platform: A Global Standard
It’s worth noting that TradingView’s native charting platform has long supported volume data for various indices, including those popular among Indian traders like Nifty50 and Bank Nifty. As a global platform with a vast user base, TradingView offers advanced charting tools, including customizable indicators and real-time data feeds. This feature is particularly useful for traders who rely on technical analysis and wish to track volume movements alongside price action. With TradingView, traders can access a wide range of indices and assets, making it a versatile tool for market analysis.