


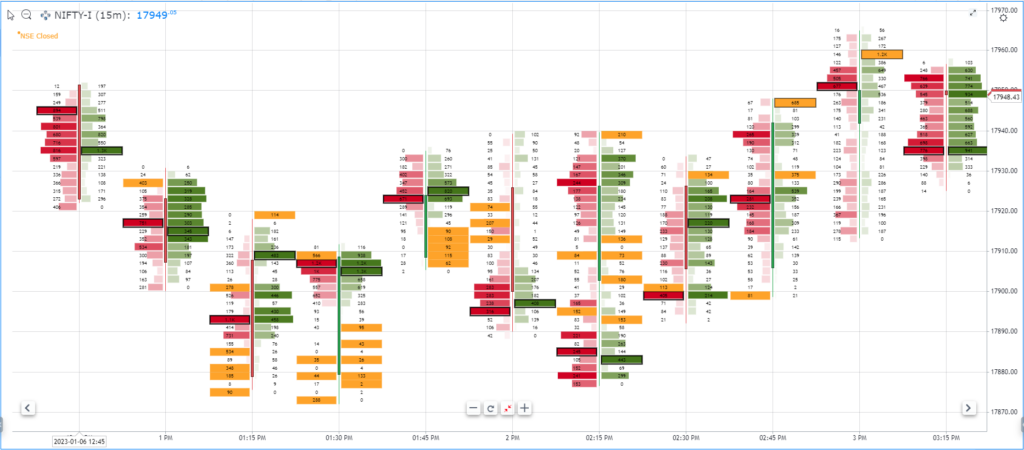
An order flow chart is a graphical representation of the flow of orders in a financial market. It shows the volume of orders and the direction of the orders (e.g., buy or sell) at different price levels over a specific period of time.
Order flow charts are typically used by traders and investors to track and analyze the supply and demand dynamics in a market. By looking at the volume and direction of orders at different price levels, traders can get a sense of whether there is more buying or selling pressure in the market, and whether the market is likely to trend upwards or downwards.
Order flow charts can be created using a variety of tools, including charting software, trading platforms, and specialized order flow analysis tools. They may be used in conjunction with other technical analysis tools, such as price charts and indicators, to help traders and investors make more informed trading decisions.
Overall, order flow charts are a useful tool for traders and investors who are interested in tracking the supply and demand dynamics in a financial market and understanding the underlying forces that drive price movements.
Key difference between order flow and traditional candlestick charts?
Order flow charts and traditional candlestick charts are both tools that are used by traders and investors to analyze financial markets and make informed trading decisions. Both types of charts can be useful in different ways and can provide valuable information to traders.
One key difference between order flow charts and traditional candlestick charts is that order flow charts show the volume and direction of orders in the market, while candlestick charts show the price movements of a financial instrument over a specific period of time. This means that order flow charts can provide insight into the supply and demand dynamics in the market, while candlestick charts show the price action of the market.
Some traders and investors may find order flow charts to be a more useful tool because they can provide insight into the underlying forces that drive price movements in the market. By looking at the volume and direction of orders at different price levels, traders can get a sense of whether there is more buying or selling pressure in the market and whether the market is likely to trend upwards or downwards.
Overall, both order flow charts and traditional candlestick charts can be useful tools for traders and investors, and the choice of which one to use will depend on the specific needs and preferences of the trader, as well as the type of analysis they are interested in performing.
What are the popular order flow analysis tools available for India?
There are a number of order flow charting tools and software packages available in India that are used by traders and investors to track and analyze the flow of orders in financial markets. Some examples of popular order flow charting tools in India include:
- GoCharting Platform ( can be accessed through web interface & mobile app )
- Tpo bell platform ( using desktop app )
- Bookmap India app ( using desktop app )
- Quant tower India app ( using desktop app )